Document Processing
Last Updated: Version R2601This set of dashboards provides valuable details about batches and documents including the number of new batches or documents generated per day, the average batch processing time, and the number of completed batches within the specified timeframe.
The charts are filtered based on three criteria: time period, batches and document data.
Topics:
To set the time period
You can filter all data in these dashboard based on time period. The data options at the top of the screen provide the ability to choose from presets such as This Month, This Quarter, This Week, or this Year or to select a custom date range using the date fields.
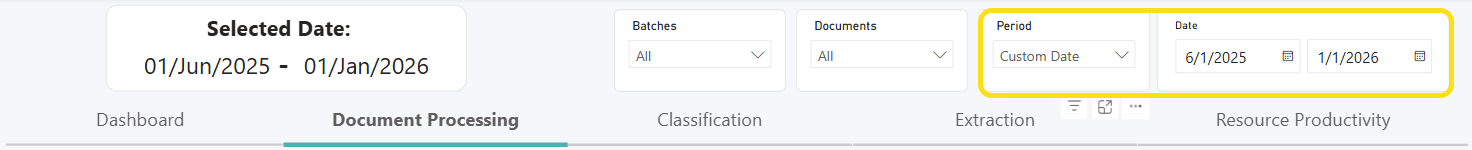
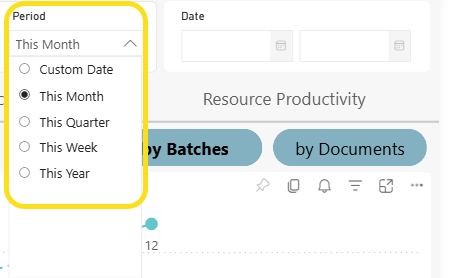
To change the period, select an option from the Period list, shown below. The Selected Date field updates after you change the selection, and the charts are updated according to the new time period.
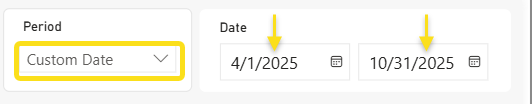
If you choose Custom Date, you need to use the Data selection option to choose a start and end date. These fields are only available when Custom Date is selected in the Period list.
If you use the Period field to select a period or the Date fields to select a custom range, the Selected Date and the Date fields are updated accordingly, as shown below.

After selecting a Custom Date, to revert back to a standard time period from the Period list (i.e. This Month, This Year, etc.), you can hover over the data box and select Clear selections when it pops up. ![]()
To set the criteria
Criteria used to create these dashboard are based on batch and document data. From each list, select one or more Batch types, and one or more Documents.

You can easily switch the view per chart by selecting by Batches or by Documents buttons, shown below.
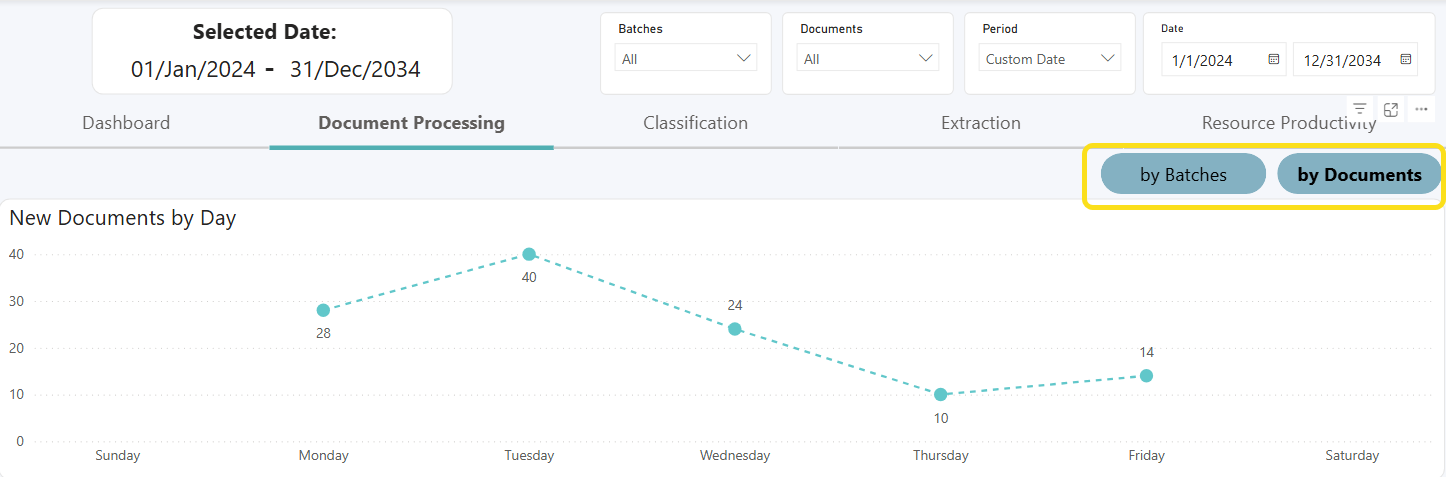
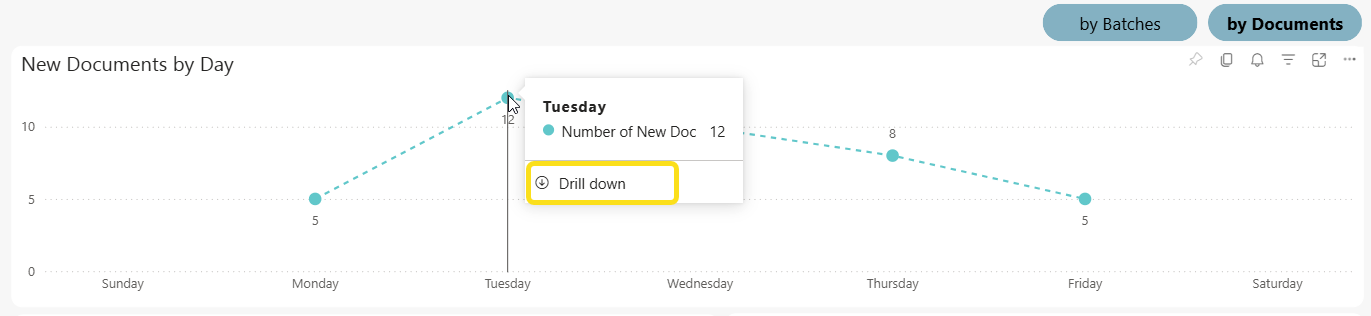
New Batches / Documents by Day
This chart provides a detailed breakdown of either new batches or new documents processed per day. Click a number in the chart to highlight the related data on the other two charts on the screen. When in the New Documents by Day view, you can hover your cursor over an entry to view drill-down information. While hovering, wait until the Drill-down option appears, and then click to view details about the specific dates that the documents were created.
Average Batch /Document Processing Time
This chart displays the average batch processing time for the three most used batch types or documents.
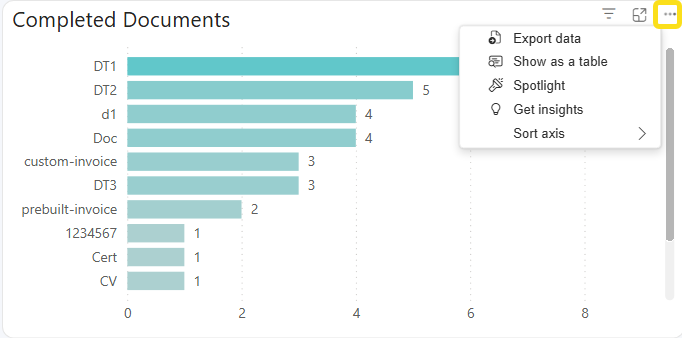
Completed Batches / Documents
When By batches is selected, the Y axis indicates the batch name; whereas the X axis indicates the total number of documents processed for that batch during the selected period.
When by documents is selected, the Y axis indicates the document name; whereas the X axis indicates the total number of documents processed during the selected period.
Focus mode and Menu Options
Each chart provides a menu and focus mode option when you hover over the top right corner. The Focus Mode icon  opens the selected visual in its own window. The more icon
  opens a submenu. The menu options are described below.
-
Export data: Provides options to export the data in the chart to a specified file format (.xlsx or .csv). Depending on the chart content, you may only be able to export summarized data. Data with the current layout is only available if you select this option for a table or matrix.
-
Show as a table: Opens a screen to view the data in both visual and table format. Click the 'Back to report' link to return to the standard view.
-
Spotlight: Focuses on the selected visual only, and fades all other data on the screen into the background. Click away from the visual to restore the normal view.
-
Get insights: Provides drill-down capabilities to view more granular data.
-
Sort axis: Allows you switch the display axes.